
Noise and dB#
Gaussian noise#
- noise (signal processing)
Unwanted modifications that a signal may suffer.
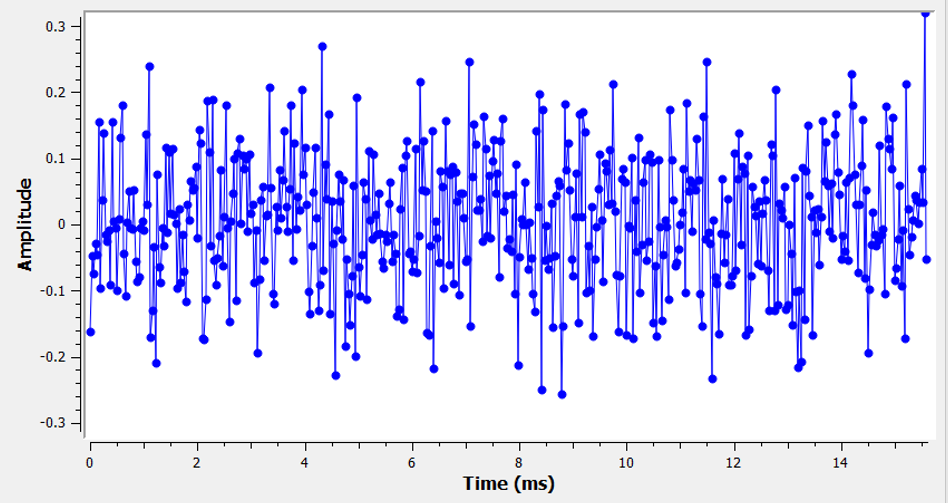
Fig. 50 A noise signal. The average is zero and higher fluctuations are more rare than the lower ones.#
Source M. Lichtman | License: CC BY-NC-SA 4.0
If the average would not be zero, then we have an easy solution for the average part: Just subtracting the average value. Then we would be left out with the rest again.
When many random things add up, then we get Gaussian noise.

Fig. 51 Many kinds of random processes added up leads to a Gaussian distribution.#
Source M. Lichtman | License: CC BY-NC-SA 4.0
Also called normal distribution or bell curve.
Has two parameters:
mean
variance
- mean \(\mu\)
average value of the distribution.
- variance \(\sigma^2\)
standard deviation \(\sigma\) of the distribution squared. It is a metric that represents how much the values deviate from the average.
For example, if both the mean and variance are 1, approximately 68% of the values will be between 0 and 2 (mean ± 1 standard deviation).
- noise power
represents how strong the noise is. Defined by the variance \(\sigma^2\). We use a square, because power is proportional to the amplitude of a signal: \(P = U^2 R\) (power equals to the square of the voltage multiplied by the resistance).
Exercise 49
Where could be the Gaussian noise helpful for us in context of wireless communication?
Exercise 50
You want to add Gaussian noise to your radio signal in GNU Radio to model system noise. You choose a mean value of 2 and a variance of 4. Your signal has the following values:
signal = [-5, -4, -3, -2, -1, 0, 1, 2, 3, 4]
Give an example output. For simplicity, stick to integer numbers.
Energy & power & duty cycle#
- energy
a quantitative property that is transferred, recognizable as work, heat, and light. Unit: J
In small batteries, we use mAh, i.e., milliampere hours. E.g., if a battery has a capacity of 1000 mAh, then it can deliver 1 A for one hour.
- power
the amount of energy transferred or converted per unit time. Unit: W
Power corresponds to voltage times current: \(P = V \cdot I\)
- duty cycle
the fraction of one period in which a signal or system is active.
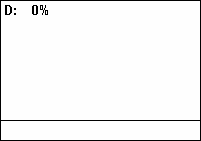
Fig. 52 Duty cycle \(D\) varied in 10% increments. The signal is active, when it is high.
Public domain. By Eighthave, modified by Teslaton. Source: Wikimedia Commons#
Exercise 51
How long can a typical rechargeable AAA battery feed the Bluetooth sensor with the following properties:
sensor consists of two main components: processor and transceiver.
transmission power of 1 mW.
device gets activated every second and transmits data, but not receives any.
the transmitter has a duty cycle of 5 %.
the processor on the sensor has an average power consumption of 5 mW when it is active.- outside the duty cycle, the device is in sleep mode and consumes 1 μW.
Decibel (dB)#
Imagine you have to compare a signal at 2W with the noise floor at 0.0000002 W. The ratio contains many zeroes, but a logarithmic metric can squeeze these zeroes.
- decibel (dB)
relative unit of measurement equal to one tenth of a bel (B). The comparison is done on a logarithmic scale and the compared values are power or root-power quantities.
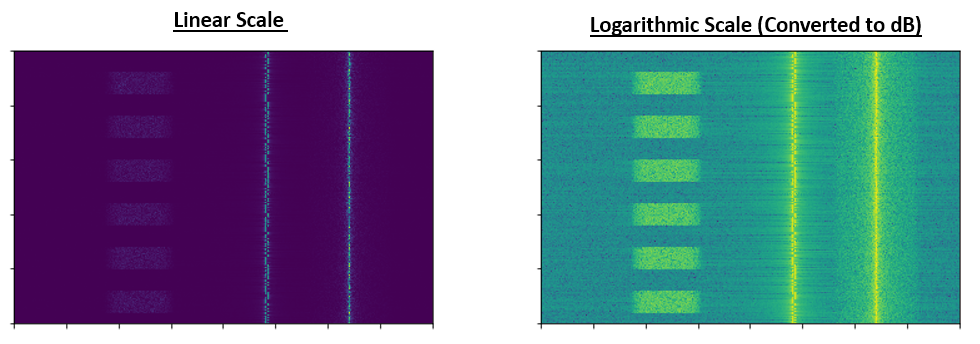
Fig. 53 Waterfall plot of three signals in linear and logarithmic scale. There are more details on the logarithmic scale.#
Source M. Lichtman | License: CC BY-NC-SA 4.0
Decibel conversion:
a signal power ratio: \(x_{\mathrm{dB}} = 10 \log_{10}x\)
10 comes from deci
a signal amplitude ratio: we use 20 instead of 10
reason: decibel compares in the power domain. If we compare amplitudes, we have to square additionally the ratio we get: \(x^2 = 20 \log_{10}x\).
In the decibel world, multiplications become additions:
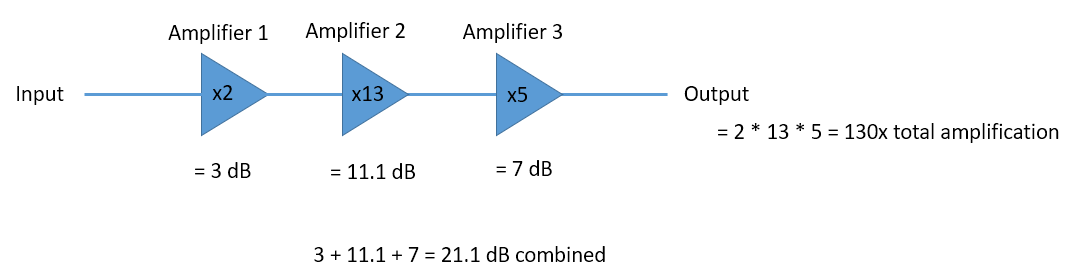
Fig. 54 Three amplification values get multiplied together, but their decibel counterparts get added.#
Source M. Lichtman | License: CC BY-NC-SA 4.0
dB is not a unit, it is just a factor represented in a domain we don’t usually use, namely logarithmic domain. Sometimes we append a unit, then it becomes relative to the lowest integer value of this unit:
dBW is relative to 1 W. 2W becomes \(10 \log_{10} 2 ~= 3 \mathrm{dB}\).
dBmW or shortly dBm is relative to 1 mW.
Transmitter is set to 3 dBW.
Means to 2 W, even 2x corresponds to ≈3.01 dB.
The signal I received was 10 dB above the noise floor.
Means SNR = 10 dB
Linear |
dB |
|---|---|
1x |
0 dB |
2x |
3 dB |
10x |
10 dB |
0.5x |
-3 dB |
0.1x |
-10 dB |
100x |
20 dB |
1000x |
30 dB |
10000x |
40 dB |
dBm |
Notes |
|---|---|
526 |
an example black hole collision |
296 |
power output of the sun |
80 |
Typical transmission power of FM radio station with 50 km range |
60 |
Typical combined radiated RF power of microwave oven elements |
27 |
Typical cellular phone transmission power |
23 |
WLAN 5 GHz |
15 |
Typical wireless LAN transmission power in laptops |
4 |
Bluetooth Class 2 radio, 10 m range |
0 |
Bluetooth Class 3 radio, 1 m range |
-10 |
Maximal received signal power of wireless network (802.11 variants) |
-100 |
Minimal received signal power of wireless network (802.11 variants) |
-111 |
Thermal noise floor for commercial GPS single-channel signal bandwidth (2 MHz) |
-127.5 |
Typical received signal power from a GPS satellite |
-174 |
Thermal noise floor for 1 Hz bandwidth at room temperature (20 °C) |
Decibel allows us to describe such a vast range from a thermal noise to a black hole collision! ↕️
Exercise 52
In the following you have transmission power data for various devices:
A Bluetooth class 3 based sensor with 1 m range: -10 dBm.
A mobile phone radio: 0.5 W.
Your laptop Wi-Fi: 32 mW.
Calculate for each case transmission power in dBW and W. You don’t have to use a calculator – approximate values are sufficient.
Noise in the frequency domain#
Gaussian noise in the time domain is also Gaussian noise in the frequency domain.
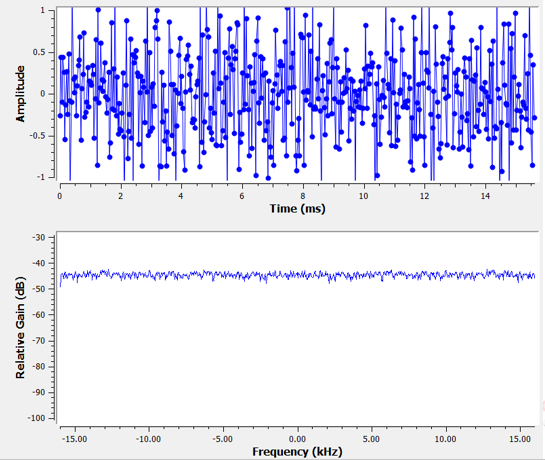
Fig. 55 Top: Gaussian noise in the time domain. Bottom: Gaussian noise in the frequency domain.#
Source M. Lichtman | License: CC BY-NC-SA 4.0
In the frequency domain we use dB, so top and bottom do not look the same.
Complex noise#
noise power is split between the real and imaginary portions, i.e., amplitude and phase.
If we apply Gaussian noise on the real and imaginary parts:
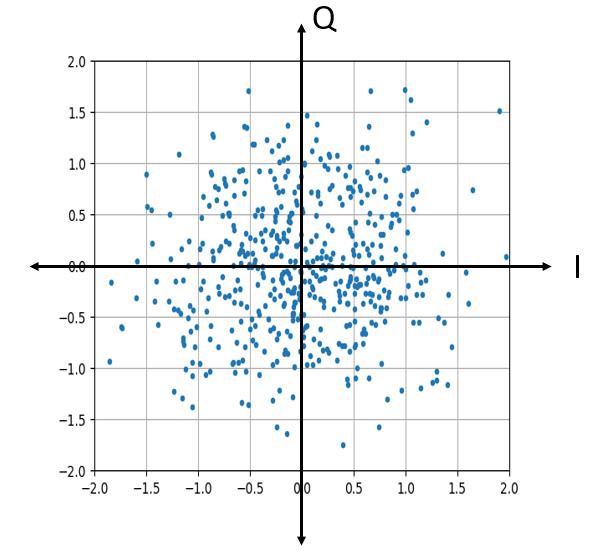
Fig. 56 IQ-plot of Gaussian noise applied on I and Q.#
Source M. Lichtman | License: CC BY-NC-SA 4.0
If we apply on a QPSK constellation:
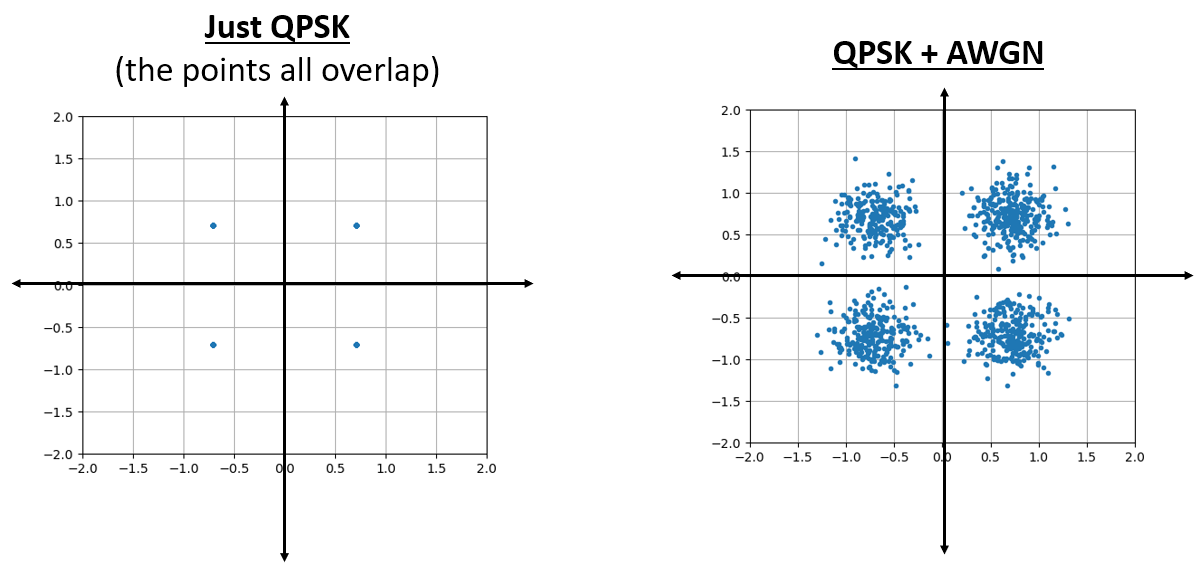
Fig. 57 a QPSK constellation on the left. With noise applied on the right. AWGN stands for additive white Gaussian noise#
Source M. Lichtman | License: CC BY-NC-SA 4.0
Increasing the power of the noise:
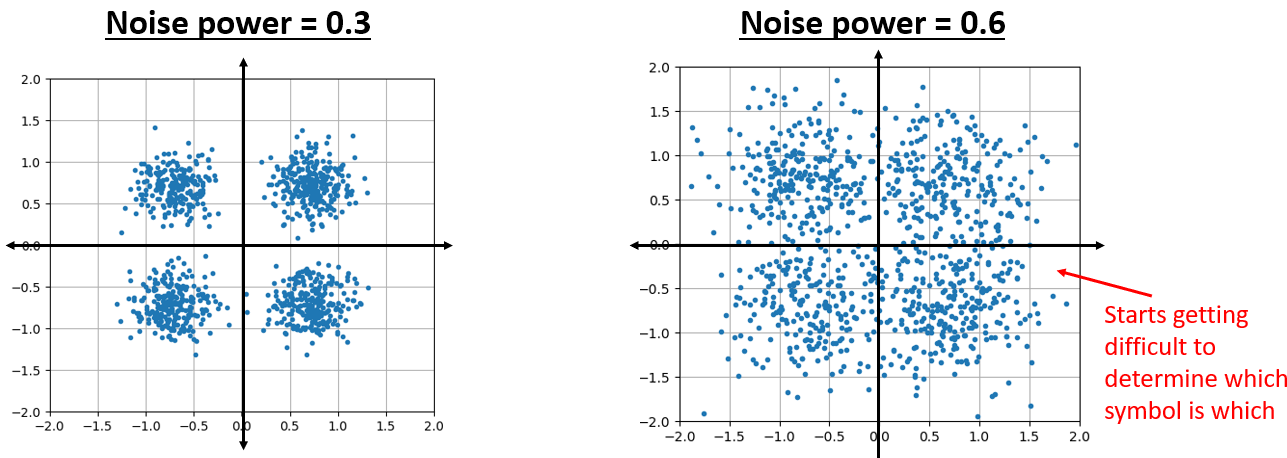
Fig. 58 QPSK constellations with different noise powers.#
Source M. Lichtman | License: CC BY-NC-SA 4.0
At noise power
0.3: we are able to differentiate in general
0.6: there is no clear separation, so decoding is more difficult. Error rate will be higher compared to the case with 0.3 noise power.
AWGN#
additive white Gaussian noise
additive: because we add the noise
white: spectrum is flat, i.e., noise applies to all frequencies equally
We can typically assume AWGN when we are talking about noise
SNR#
- signal-to-noise ratio (SNR)
measure that compares the level of a desired signal to the level of background noise.
\(\mathrm{SNR} = \frac{P_\mathrm{signal}}{P_\mathrm{noise}} \)
In the dB domain, we just subtract the values.
Examples:
0 dB: signal and noise power are the same
positive: signal has a higher power than noise
negative: it is difficult to detect, however not impossible. Refer to the GPS signal levels on the previous table.
Exercise 53
Your laptop is connected to a Wi-Fi station and the signal you receive has the following power:
$ iw dev wlp0s20f3 station dump | grep 'signal avg'
	signal avg:	-45 dBm
	beacon signal avg:	-45 dBm
What is the SNR assuming a noise power of -90 dBm?
Is the received signal power acceptable?
Appendix#
SINR#
Noise comes from two sources:
thermal noise in the receiver
interference from other radio signal sources
- Signal-to-interference-plus-noise ratio
Compared to SNR, also interference or disturbance from other signal sources are accounted

Fig. 59 The base station wants to receive the green signal S, but is interfered by the red signals.
CC BY-SA 4.0. By Kirlf. Source: Wikimedia Commons#