
Digital modulation#
Overview#
Goals:
bandwidth efficiency
transmit as much information using a given bandwidth.
technically: maximize spectral efficiency (bit/s/Hz)
we already introduced this concept here: Spectral efficiency
power efficiency
preserve fidelity (i.e., integrity) at low power levels
technically: keep an acceptable bit error probability
There is a trade-off between bandwidth and power efficiency.
Exercise 40
To transmit more information, we could also simply send bits faster (by increasing the frequency). Can’t we?
Why digital modulation? From Rappaport, 2024, section 6.4:
greater noise immunity to channel impairments
easier multiplexing of various media, e.g., voice, image, text
better security (typically, encryption is based on digital signals)
error-detection, -correction codes
modern processors enabled software-defined modulators
Symbols#
symbol
a defined signal level on our carrier signal
could represent many bits but also simply one
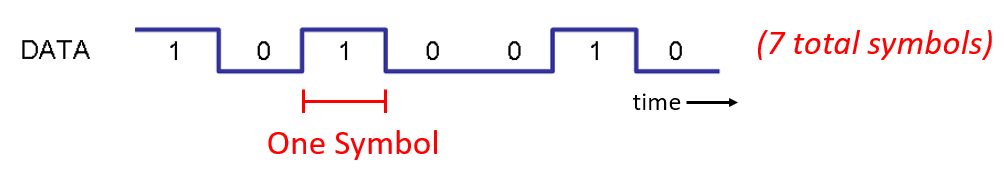
Fig. 27 Example of a symbol in context of 7 bits.#
Source M. Lichtman | License: CC BY-NC-SA 4.0
for example Ethernet uses the following 4-level amplitude modulation (among others):
Symbol |
00 |
01 |
10 |
11 |
|---|---|---|---|---|
Line signal level |
+1V |
+.5V |
-.5V |
-1V |

Fig. 28 One of the Ethernet modulation schemes.#
Source M. Lichtman | License: CC BY-NC-SA 4.0
Exercise 41
Assume previous modulation scheme, and each symbol takes 8ns.
How much is the bit rate?
Two bits are transmitted through a twisted pair (of cables) . How many pairs do we need to transmit 1 Gbit/s? Now you extend the table to 16 symbols.
How many bits/symbol do we have now?
How many bit/s?
Wireless symbols#
We cannot simply use every modulation technique to wireless symbols
a symbol on the cable can also have static levels, e.g., +1V for long time. Electromagnetic transmission requires waves
low frequencies require very long antennas. Generally, an antenna should be at least \(\frac{\lambda}{4}\) long. E.g., a 300 kHz would require \(\frac{300e6 \cdot \mathrm{m/s}}{300e3 \cdot 1/\mathrm{s}} /4 = 250\,\mathrm{m}\) long antenna
wireless world is a shared medium. A wireless signal should be bandwidth limited avoid disturbing the neighboring frequencies, i.e., communication channels.
A wireless antenna requires a periodic waveform. Typically a sinusoidal signal is used. We start with a carrier signal and modulate it.
- modulation
Process of varying one or more properties of a periodic waveform, called the carrier signal, with a separate signal called the modulation signal that typically contains information to be transmitted.
We can for instance change the amplitude to modulate the carrier signal.
Exercise 42
What else other than amplitude can we change?
In the chapter The lost emergency signal we saw amplitude modulation, where we used an amplitude-modulated analog signal on a carrier signal in the hundreds of MHz. In the following we will focus on digital modulation schemes, but touch on AM and FM in section Frequency shift keying (FSK).
An overview of modulation schemes follow:

Fig. 29 Signal modulation schemes. In wireless communication we use an analog carrier.
CC BY-SA 4.0. By Michel Bakni. Source: Wikimedia Commons#
Amplitude shift keying (ASK)#
We shift the amplitude of the carrier signal. E.g., 2-ASK:

Fig. 30 20 modulated symbols using a 2-ASK scheme#
Source M. Lichtman | License: CC BY-NC-SA 4.0
We can also define 4 amplitudes and get 4 symbols, i.e., 4-ASK:

Fig. 31 20 modulated signals using a 4-PSK scheme#
Source M. Lichtman | License: CC BY-NC-SA 4.0
Exercise 43
You want to encode data using ASK and transmit it over a wireless channel with a carrier signal. First, you sample your data and create your baseband signal.
What do you do after creating your baseband signal? In other words, what do you have to to do typically before transmitting the encoded signal before transmission?
Phase shift keying (PSK)#
Now, let us modulate phase instead. For example binary PSK (BPSK) uses two levels:
no phase change
180 degrees phase change
Example:

Fig. 32 Each symbol is represented by one period. If the symbol changes, then 180 degree offset carrier signal is applied.#
Source M. Lichtman | License: CC BY-NC-SA 4.0
It is not convenient to analyze a PSK signal as follows:

Fig. 33 BPSK has sudden changes#
Source M. Lichtman | License: CC BY-NC-SA 4.0
For representing the changes in the phase, the domain of complex numbers is more useful.
IQ plots/constellations#
- IQ plot
a plot, which visualizes an IQ signal on a complex plane.
- Constellation
visualizes available symbols in a modulation scheme
Example for a BPSK:
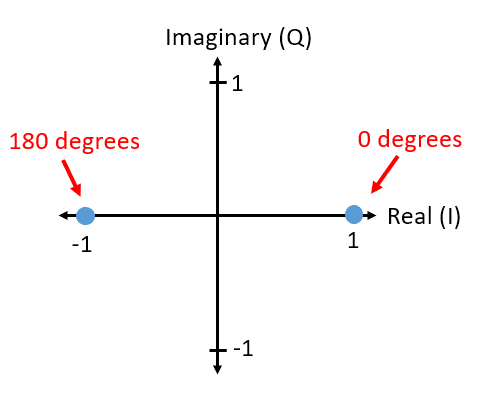
Fig. 34 An IQ plot showing the constellation of a BPSK scheme. Two dots represent the available symbols.#
Source M. Lichtman | License: CC BY-NC-SA 4.0
Back to PSK#
Typically we don’t know when is the right time to sample, so we may get the following IQ plots for a BPSK signal:
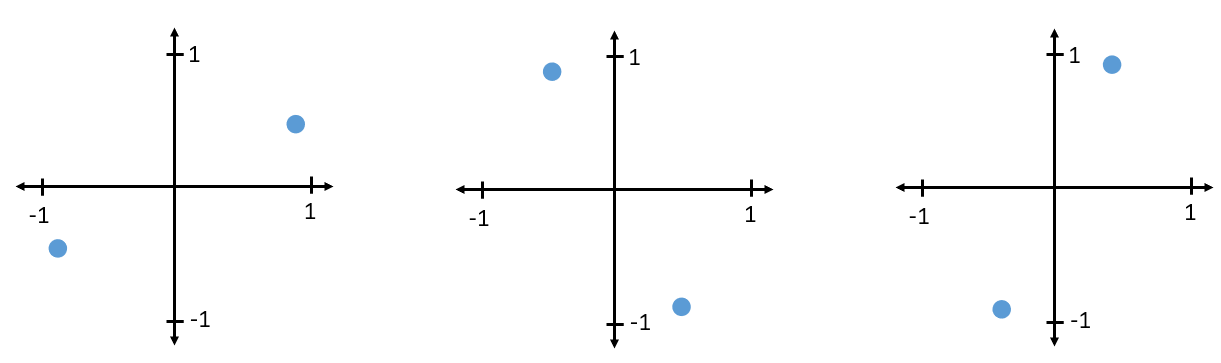
Fig. 35 Three different BPSK waveforms we may get without synchronization#
Source M. Lichtman | License: CC BY-NC-SA 4.0
Example for QPSK:
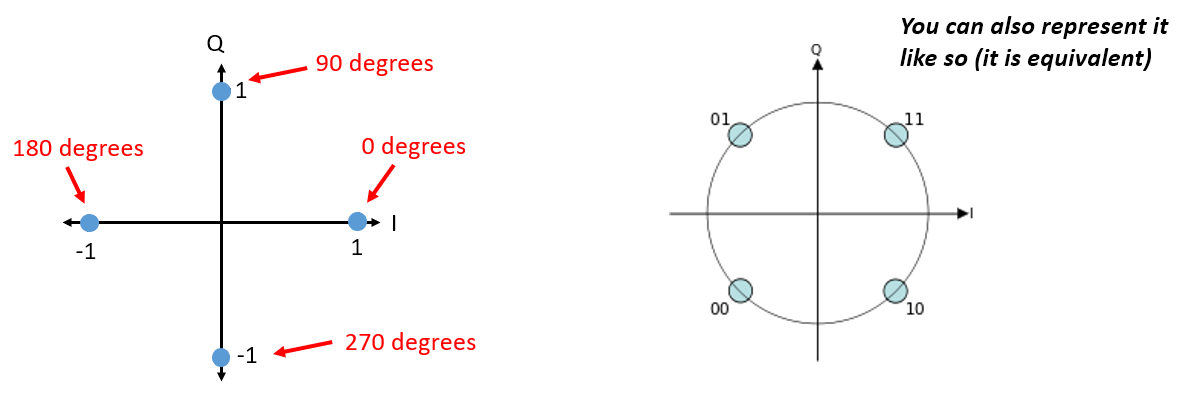
Fig. 36 In QPSK, the modulations signal shifts the carrier signal by 0, 90, 180 or 270 degrees.#
Source M. Lichtman | License: CC BY-NC-SA 4.0
- PSK
a modulation scheme where symbols differ only by their phase. Typically they are equally distant from each other in terms of phase for best protection against noise.
Examples:
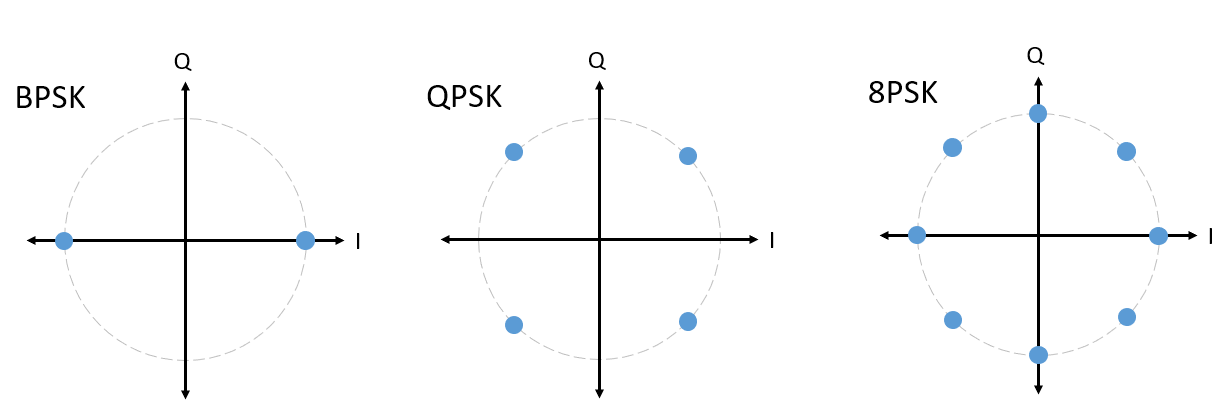
Fig. 37 In QPSK, the modulations signal shifts the carrier signal by 0, 90, 180 or 270 degrees.#
Source M. Lichtman | License: CC BY-NC-SA 4.0
Exercise 44
Is the constellation below a PSK scheme?
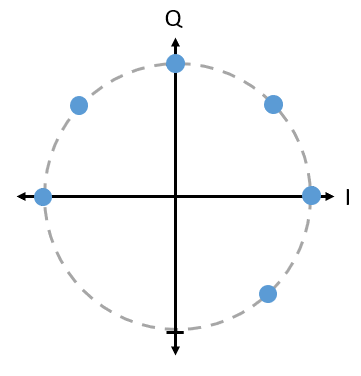
Fig. 38 A PSK scheme with six symbols#
Source M. Lichtman | License: CC BY-NC-SA 4.0
Back to ASK
Exercise 45
Draw the constellations of the two ASK schemes we used in section Amplitude shift keying (ASK).
Quadrature amplitude modulation (QAM)#
- QAM
Modulates both amplitude and phase, i.e., ASK + PSK. There is a common minimal distance between the symbols is at least.
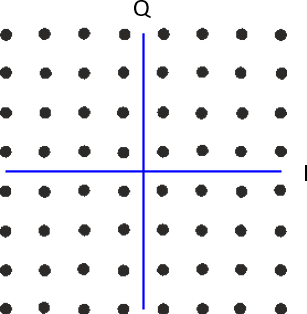
Fig. 39 64QAM consisting of 64 symbols. The symbols are aligned on a horizontal and vertical grid.#
Source M. Lichtman | License: CC BY-NC-SA 4.0
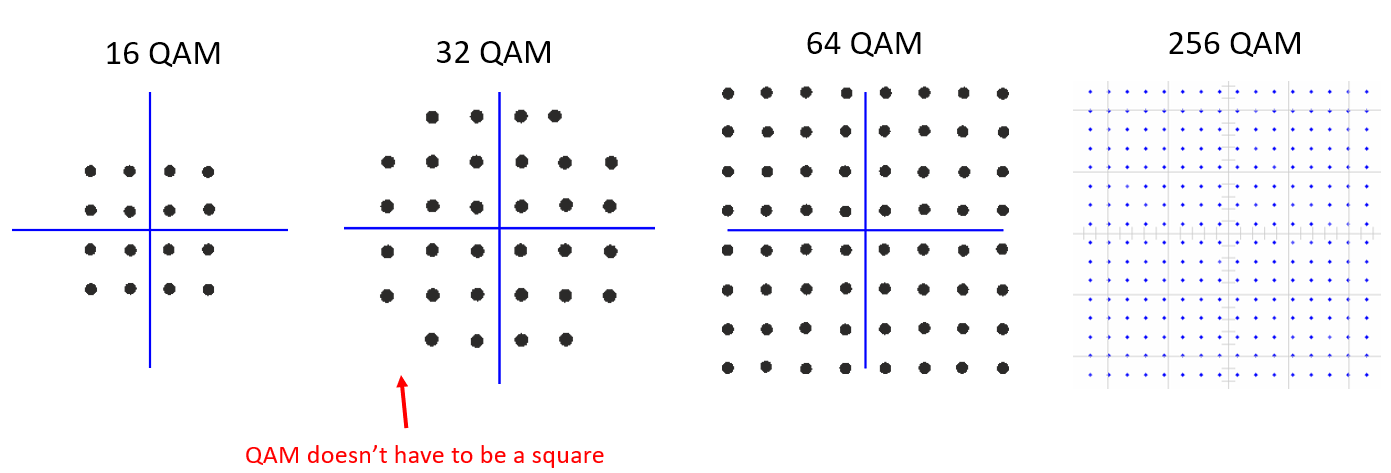
Fig. 40 Various QAM schemes.#
Source M. Lichtman | License: CC BY-NC-SA 4.0
Similar to PSK, QAM is not easy to read the symbols from the time diagram, so constellation plot is preferred.
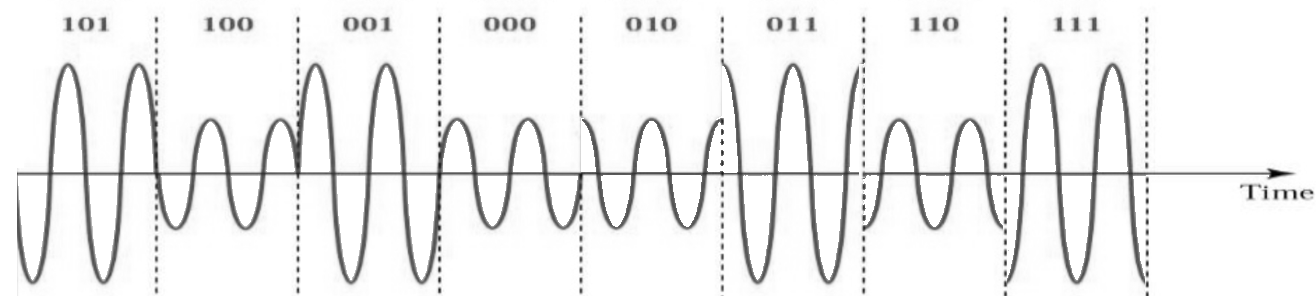
Fig. 41 a QAM modulated signal consisting of 8 consecutive symbols in the time domain.#
Source M. Lichtman | License: CC BY-NC-SA 4.0
Frequency shift keying (FSK)#
- FSK
Symbols are modulated by shifting the frequency.
For example symbols of a 4-FSK:
+100 kHz
+300 kHz
-100 kHz
-300 kHz

Fig. 42 PSD of a 4-FSK signal. Maximum PSD apparent at four frequencies. The difference \(∆ f\) is about 200 kHz.#
Source M. Lichtman | License: CC BY-NC-SA 4.0
Exercise 46
How do we represent FSK on a constellation diagram?
More than 2 frequencies would be not easy to distinguish in the time domain:

Fig. 43 2-FSK modulation of 8 bits.#
Source M. Lichtman | License: CC BY-NC-SA 4.0
The analog modulation scheme frequency modulation (FM) is like an analog version of FSK. Instead of modulating discrete symbols, we modulate a continuous analog signal:
Fig. 44 The black analog signal modulated using AM and FM. If the signal voltage drops, then AM reduces the amplitude, whereas FM reduces the frequency.
CC BY-SA 2.5. By Berserkerus. Source: Wikimedia Commons#
Further resources#
Rappaport, 2024, section 6.4
Appendix#
Differential coding#
Imagine BPSK. The receiver needs to know where a period of the signal begins, because the interpretation differs dependent on when we sample. Additionally the receiver may not know at which frequency it should sample. The act of finding the frequency and the phase is called:
- Carrier recovery
used to estimate and compensate for frequency and phase differences between a received signal’s carrier wave and the receiver’s internal frequency and phase. Devices use a local oscillator as a clock reference.
For correct demodulation, the BPSK receiver must recover the frequency and the phase of the signal to know where each symbol begins. However, the receiver might recover the carrier with a 180° phase offset, causing all +1s to be interpreted as -1s and vice versa. This happens because the carrier recovery circuit (like a PLL) can lock to either phase.
Example: Signal begins with 1, so it is a \(\cos\) signal. Data could also begin with a 0, which is a \(-\cos\). So, it is fully acceptable to start sampling a zero-crossing. If the receiver samples 180 degrees after 1 started, then it will sample a \(-\cos\), which is a -1.

Fig. 45 Errors caused by not correctly recovered receiver phase in QPSK. O resembles an actual symbol, X the received symbol. The local oscillator is not synchronized with the transmitted signal and samples at the wrong point.
CC BY-SA 3.0. By Lemoneade10. Source: Wikimedia Commons#

Fig. 46 Errors caused by not correctly recovered receiver frequency in QPSK. Transmitter and receiver have different frequencies in their local oscillators. Result: The received symbols gradually move in directions of the arrows. In other words, QPSK symbols rotate with time as indicated by arrows.
CC BY-SA 3.0. By Lemoneade10. Source: Wikimedia Commons#
Solutions for the recovery problem:
Use a known preamble sequence to establish the correct absolute phase reference, e.g., -1, 1, 1, -1.
Use differential encoding where data is encoded in phase changes rather than absolute phases, making it immune to 180° phase ambiguity.
Example, where output starts with a 1 and differentially generates following symbols.
Input:     1 1 0 0 1 1 1 1 1 0
Output:  1 0 1 1 1 0 1 0 1 0 0

Fig. 47 Differential encoding and decoding examples starting with 1 and 0.#
Source M. Lichtman | License: CC BY-NC-SA 4.0
BER vs SNR for differential coding#
- Bit error rate
the number of bit errors divided by the total number of transferred bits during a time interval
Bit errors can happen due to noise, interference, synchronization errors, etc.
rule of thumb: a BER of \(10^{-3}\) is acceptable
for medical applications: \(10^{-10}\) may be desired
- \(E_\mathrm{b}/N_0\)
energy per bit to noise power spectral density ratio. \(E_\mathrm{b}\) is energy per bit, \(N_\mathrm{0}\) is noise power per Hz (power spectral density ratio).
Also called SNR per bit.
is a power efficiency metric
Useful for comparing BER without taking bandwidth into account. This is where \(N_\mathrm{0}\) comes from.
more bandwidth means more noise

Fig. 48 BER of differentially encoded BPSK vs normal BPSK using AWGN. Differential encoding improves BER for a fixed SNR per bit.
CC BY-SA 3.0. By Splash. Source: Wikimedia Commons#
BER vs SNR for different modulation schemes#

Fig. 49 Bit error rate (BER) vs \(E_\mathrm{b}/N_0\) for various modulation schemes. Per unit noise (\(N_0\)), QPSK and BPSK have the highest energy efficiency. If we require more bandwidth efficiency, then we can choose other modulation schemes on the right.
CC BY-SA 3.0. By Splash. Source: Wikimedia Commons#
Exercise 47
BPSK and QPSK have the same plot for BER vs \(E_\mathrm{b}/N_0\), even they are different modulation schemes. How come?
Remember the trade-off between bandwidth efficiency and power efficiency. n-PSK can send more bits per symbol and thus increases the bandwidth efficiency. At the same time the power required per bit increases, which in turn decreases power efficiency.
We will use this information later in the link budget by dividing the received power by the bit rate, which will give us the \(E_\mathrm{b}\). Then we can compare whether the modulation technique is reliable enough:
\( E_\mathrm{b} = \frac{P_\mathrm{rx}}{R_\mathrm{b}} \)
\(E_\mathrm{b}\): energy per bit
\(P_\mathrm{rx}\): received signal power
\(R_\mathrm{b}\): bit rate
We can derive \(N_0\) from the thermal noise formula () by dividing the noise power by the bandwidth:
\( N_0 = \frac{P_\mathrm{noise}}{B}\)
Exercise 48
Which signal power is required to achieve BER of \(10^{-10}\) under the following conditions?
QPSK
bit rate of 100 kbit/s during transmission?